Why Is the Decibel Scale Logarithmic?
Why sound levels use a logarithmic scale, what common dB changes mean physically, and why decibel values cannot be handled like ordinary linear numbers.
The decibel scale is logarithmic because sound spans an enormous physical range and because acoustics often deals with ratios rather than simple absolute differences. A logarithmic scale compresses huge pressure and energy changes into manageable numbers. It also turns multiplication of physical ratios into addition of decibel changes. NIST BIPM
What Is a Decibel? A Simple Guide to Sound Levels
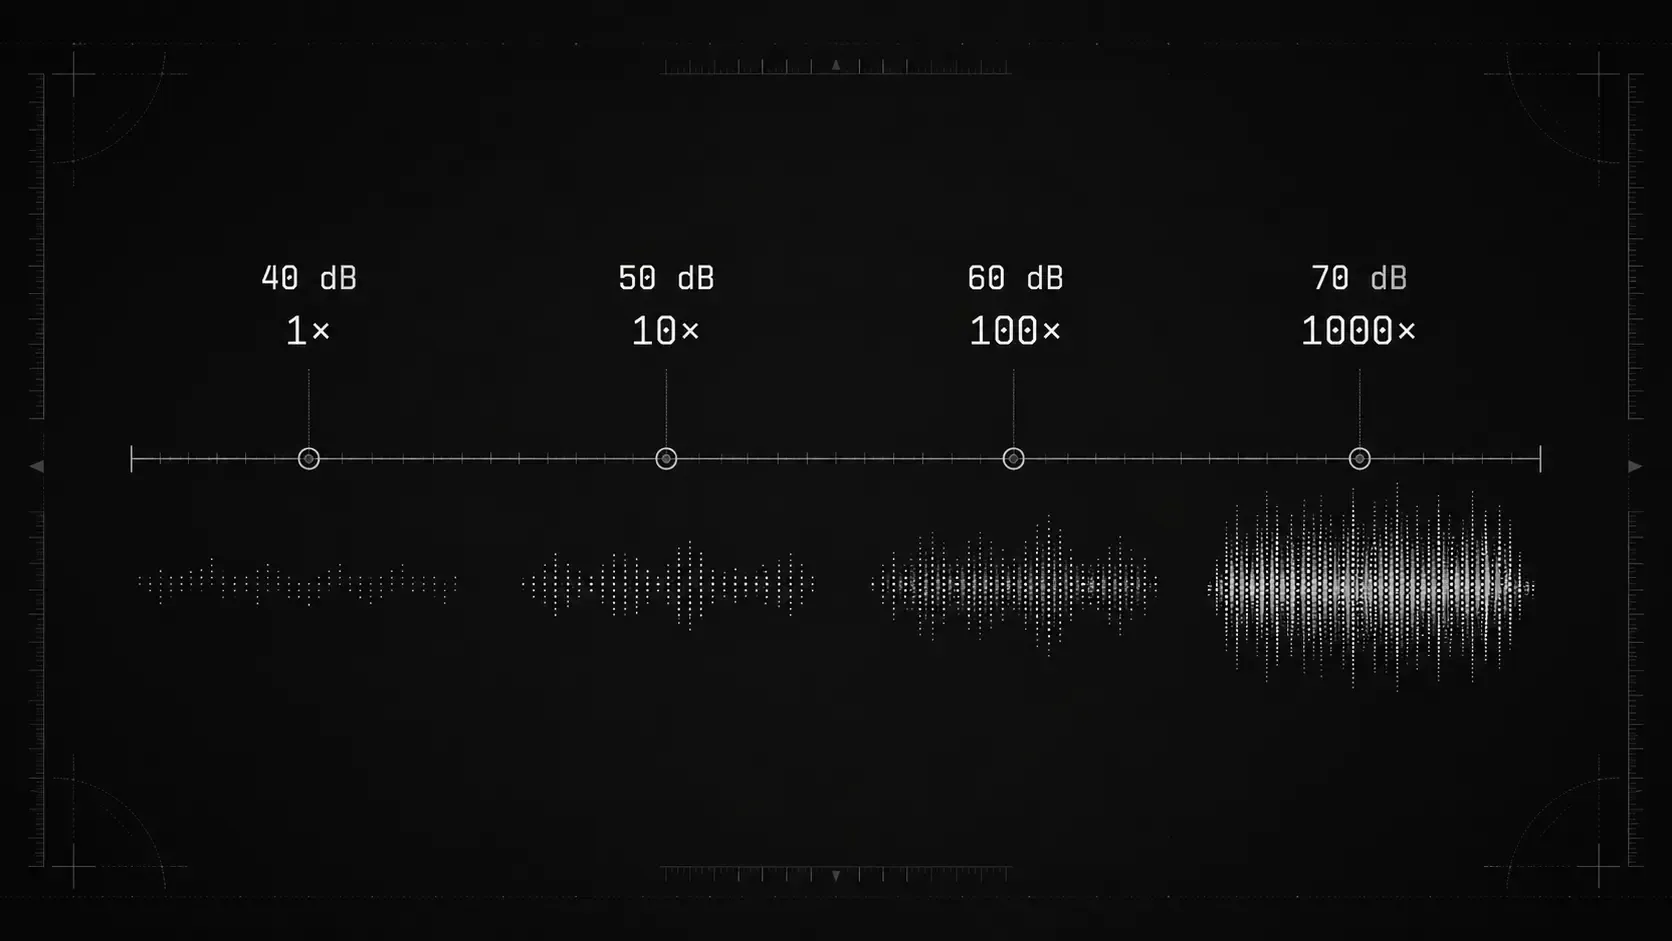
A linear sound scale would be awkward
Very faint audible sound pressures are tiny compared with the pressures produced by very high sound levels. If sound meters displayed pressure directly, the useful range would stretch across many orders of magnitude.
For airborne sound pressure level, 20 micropascals is the standard reference pressure. That pressure corresponds to 0 dB SPL. A pressure of 2 pascals corresponds to 100 dB SPL, and 20 pascals corresponds to 120 dB SPL. The pressure ratio between 20 micropascals and 20 pascals is one million to one, while the decibel difference is 120 dB. BIPM
The logarithmic scale makes such comparisons readable without hiding the physical ratio behind a long string of zeros.
The two common decibel formulas
For a power-like quantity such as intensity or energy, the level difference is:
For an amplitude-like quantity such as sound pressure, the level difference is:
The factor 20 does not create a second definition of the decibel. It appears because acoustic power is proportional to the square of pressure under comparable conditions. Applying the 10 log rule to the squared pressure ratio produces the 20 log form. BIPM
What 3 dB, 6 dB, 10 dB, and 20 dB mean
The logarithmic relationship gives each common level change a precise physical meaning.
| Level change | Intensity or energy ratio | Sound pressure amplitude ratio |
|---|---|---|
| 3 dB | about 2 times | about 1.41 times |
| 6 dB | about 4 times | about 2 times |
| 10 dB | 10 times | about 3.16 times |
| 20 dB | 100 times | 10 times |
The exact level increase for doubled energy is about 3.01 dB, so 3 dB is the accepted rounded form. NIOSH
A 6 dB increase has two different but compatible descriptions. The pressure amplitude is approximately doubled, while the intensity or energy is approximately four times greater. This is why statements about decibel changes must identify whether they refer to pressure amplitude, energy, or perception.
A 10 dB increase is ten times the intensity or energy. It is often described as sounding roughly twice as loud, but that perception rule is only approximate. It varies with the spectrum, starting level, duration, listening conditions, and listener. NIDCD
Is 3 dB Twice as Loud? Sound Energy vs Perceived Loudness
Why ratios become differences
A logarithm changes multiplication into addition. Suppose one part of an audio or acoustic system increases power by a factor of 10, which is 10 dB. A second stage doubles the power, which is about 3 dB. The combined power ratio is 20 to 1, and the combined level change is about 13 dB.
This is useful because gains, losses, transmission effects, and source combinations often multiply in the physical system. Engineers can work with additions and subtractions in decibels instead of repeatedly multiplying large ratios.
The same principle explains attenuation. A reduction of 10 dB means the intensity is divided by 10. A reduction of 20 dB means it is divided by 100.
Why ordinary addition gives the wrong answer
Two 60 dB sound sources do not usually produce 120 dB when combined. Each 60 dB value represents a logarithmic ratio. The underlying mean-square pressures or intensities must be combined first, and the result must then be converted back to decibels.
For two independent equal-level sources, the combined result is commonly about 3 dB higher than either source alone. Two independent 60 dB sources therefore produce about 63 dB, not 120 dB.
That rule assumes independent or incoherent signals. Two coherent tones can add or cancel depending on phase and microphone position. Perfectly in-phase pressure signals can produce a larger increase, while out-of-phase signals can reduce the level at a particular point.
A full treatment of adding and averaging decibel levels belongs in a separate calculation guide.
The scale is not a direct model of loudness
The logarithmic scale fits many acoustic comparisons and broadly matches the compressive character of hearing, but a dB value is not a complete loudness prediction.
Perceived loudness depends on frequency content, duration, temporal variation, starting level, listening environment, binaural presentation, adaptation, masking, age, and hearing status. Modern loudness models account for more variables than a single level difference.
The decibel scale therefore solves a measurement and ratio problem. It does not convert physical sound into one universal measure of subjective experience.
Using the logarithmic scale correctly
A decibel difference is meaningful only when the compared quantities are compatible. Two sound pressure levels can be compared when the reference, weighting, bandwidth, and measurement method are sufficiently consistent. A dBA result should not be treated as directly interchangeable with a dBC result, and an energy average should not be replaced with an arithmetic mean of displayed dB values.
When interpreting a change, ask what physical quantity produced the number. A 3 dB energy increase, a 6 dB pressure increase, and a perceived change in loudness describe different aspects of the same sound.
Compare level changes with dBcheck
A practical way to see the logarithmic scale is to measure the same source at several controlled conditions, such as two operating settings or two fixed positions. Keep the phone orientation, distance, and measurement duration consistent. dBcheck can show estimated changes for comparison, but the result remains dependent on the phone, microphone, processing, and calibration.
Sources
- NIST, Exactly How Loud Is That Jackhammer? https://www.nist.gov/news-events/news/2018/08/exactly-how-loud-jackhammer
- BIPM, The International System of Units (SI Brochure), 9th edition. https://www.bipm.org/documents/20126/41483022/SI-Brochure-9-EN.pdf
- CDC/NIOSH, Evaluation of Impact and Continuous Noise Exposure. https://www.cdc.gov/niosh/hhe/reports/pdfs/2007-0075-3251.pdf
- NIDCD, How Loud Is Too Loud? https://www.nidcd.nih.gov/health/how-loud-too-loud